Retirement Planning and Investing Research

Below you’ll find a listing of all of the research I’ve read about retirement planning and investing (well, at least the research I’ve uploaded. Much more to come). The research includes academic articles, white papers, blog posts, podcasts, videos, and even Twitter threads. I include anything that I find interesting, useful, or important. You can search through my research archives in the Topics dropdown to the right.

  • Kentucky Windage for Asset Allocation

    Publication Year: 2022

    The paper provides simple adjustments one can make to their asset allocation to adjust for the embedded tax liability of a pre-tax IRA.

    Taxes reduce the value of investments in tax-advantaged accounts, creating a discrepancy between pre-tax and after-tax asset allocation. To correct for this, a “Kentucky windage” adjustment increases the pre-tax bond allocation by a percentage determined by tax rate, IRA size, and stock/bond mix. This ensures the after-tax asset allocation aligns with the intended target, mitigating the risk of holding a portfolio with a higher than expected stock allocation.

    Note: I believe that after-tax asset allocation attempts to solve a problem that doesn’t exist. There’s no reason to treat taxes in some special way over and above any other expense that we have. The fact that the amount and timing of tax liability is based on the amount and timing of a distribution from pre-tax or taxable accounts doesn’t change this.

  • Spending Trajectories After Age 65

    Publication Year: 2022

    Retirees spend less, on an after-inflation basis, as they age, regardless of income.

    Key findings from the report:

    • Real spending—that is, spending adjusted for inflation—declined for both single and
      coupled households after age 65 at annual rates of about 1.7 percent and 2.4 percent,
      respectively.
    • Real spending declined for all initial wealth quartiles, although with some modest
      variation.
    • The fact that spending declines broadly, including among those in the highest wealth
      quartile, suggests that the decline may not be related to economic position. (See Figure
      S.1.)
    • The view is supported by an analysis of budget shares, the fraction of total spending
      devoted to subcategories of spending.
    • The budget share for gifts and donations increases with age, which suggests that
      economic position on average does not deteriorate with age, even as spending declines.

  • Asset Allocation for a Lifetime

    Publication Year: 1996

    This paper follows his famous 1994 paper on the 4% rule and addresses six questions: (1) should retirees reduce their stock allocation each year, (2) what should their asset allocation be at retirement, (3) how the 4% rule works in taxable accounts, (4) taking withdraws in excess of 4%, (5) how early retirement affects the 4% rule, and (6) asset allocation before retirement.

    The paper address the following topics:

    1. Should retirees reduce their stock allocation each year: “All things considered, I recommend that you adopt a phase-down of one percent of your stock allocation each year, shifting it into intermediate-term bonds. This is a subjective recommendation, in that the one-percent phased portfolio looks like a good compromise between growth of wealth, withdrawal rate, and late-retirement volatility. It satisfies my personal “Goldilocks test”: neither too big, nor too small, but just right. You may build less wealth than otherwise if the markets are strong, but you will be spared considerable pain in a major market event later in retirement. And you can use virtually the same withdrawal rate as you would have had with the zero-percent phased portfolio.”

    2. What should a retiree’s initial asset allocation be at retirement: “I recommend a starting percentage of 63 percent in stocks [for moderate risk investors], which is in the middle of the range of 50-percent to 75-percent stocks. For conservative risk investors, I would recommend a 50 percent allocation of stocks to address their abiding fears of a stock market decline. For aggressive-risk investors interested in maximizing wealth to pass on to their heirs, I might recommend the maximum 75-percent stock allocation. All investors can use the same initial withdrawal rate, about 4.1 percent.”

    3. How the 4% rule works in taxable accounts: “Note that the top line of the chart, for zero-percent tax rate, is the result I gave in my earlier research for taxdeferred accounts. It maxes out at about 4.1 percent for a stock allocation of about 55 percent. It is clear from the chart that as the tax rate is increased, the maximum withdrawal rate declines. This matches expectations, because the portfolio is earning ever lower after-tax rates of return as the tax rate climbs. Withdrawals must thus be reduced to preserve portfolio capital.”

    4. Can a retiree take withdraws in excess of 4%: “Thus, for the purpose of deciding by what percentage to exceed the “safe” withdrawal rate, the probabilities of making it through retirement are about the same for tax-deferred and taxable portfolios. You can choose from these charts the odds you feel comfortable with, and we can adjust your initial withdrawal rate accordingly. I would advise you to be careful with any withdrawal rates having a probability of “success” much less than 85 percent, which corresponds to an increase in withdrawals above the “safe” level of about 11 percent, and a minimum portfolio longevity of about 24 years. . . .”

    5. How early retirement affects the 4% rule: For a person retiring at age 50 and expecting a 45-year retirement, the initial safe withdrawal rate falls to 3%. In addition, Bengen recommended the following asset allocation: “I will reduce your stock by one percent a year, according to the following formula: % of portfolio in stocks = 115 minus your age for conservative investors, % of portfolio in stocks = 128 minus your age for moderate risk, and % of portfolio in stocks = 140 minus your age for aggressive investors.

    6. What’s the ideal asset allocation before retirement: Lifetime asset allocation for virtually all clients can be managed through use of the following two asset allocation equations: Tax-deferred accounts: % of portfolio in stocks = ( 115 to 140) minus your age Taxable accounts: % of portfolio in stocks = (120 to 145) minus your age.

  • J.P. Morgan 2024 Guide to Retirement

    Publication Year: 2024

    Offers data on retirement topics, such as longevity, savings requirements and Social Security claiming strategies.

    J.P. Morgan’s annual guide to retirement offers a fascinating glimpse into the world of retirement. Here are some of the facts and figures I found noteworthy:

    1. In a non-smoking couple in excellent health age 65, there is a 73% chance that at least one of them will live to age 90 (slide 4).
    2. While 68% of those surveyed expected to work until age 65 or older, 31% achieved this goal (slide 6).
    3. Of those who households that retired in the 60s, 53% of them have at least one member who some work income (slide 7).
    4. A Social Security claiming strategy can be found on slide 10 and a comparison of strategies on slide 11.
    5. Several slides show how much one needs in retirement and how much they should be saving to meet that need based on age and income (slides 13-17).
    6. The benefits of saving and investing early (slide 19).
    7. The benefits of automatically increasing your savings each year are life-changing (slide 20).
    8. There is a suggested order of savings by account type at slide 25.
    9. Slides 31 and 32 show changes in spending as we age; spending declines significantly in retirement, even as healthcare expenses rise.
    10. Shows how much retirees would have left after 30 years if they followed the 4% rule (slide 33).
    11. Introduces the term “dollar cost ravaging” to describe sequence of returns risk and recommends dynamic spending rules as one way to mitigate these risks (slide 35).
    12. Includes several slides on Medicare strategies, including for those who work past 65 (slides 36 to 40).
    13. Slide 47 has data on the effects of being out of the market on its best days.

  • When Nest Eggs Need a Safety Net

    Publication Year: 2023

    Retirees of all income levels can increase their retirement spending and protect against longevity risk by buying an income annuity with 30% of their retirement savings

    Blackrock’s study noted two seemingly contradictory findings. First, according to a 2023 Blackrock study (BlackRock, Read on Retirementâ„¢, 2023.), only 21% of workers believe they will have enough money to last through retirement. Second, a 2018 Blockrock study (BlackRock, EBRI, “To Spend or Not to Spend,” 2023 (updated from 2018)) found that most retirees had 80% of their pre-retirement savings after two decades of retirement. These results were found across all income levels, leading Blockrock to conclude that it’s a behavioral issue, namely, that retirees don’t like watching a “leaky bank account.”

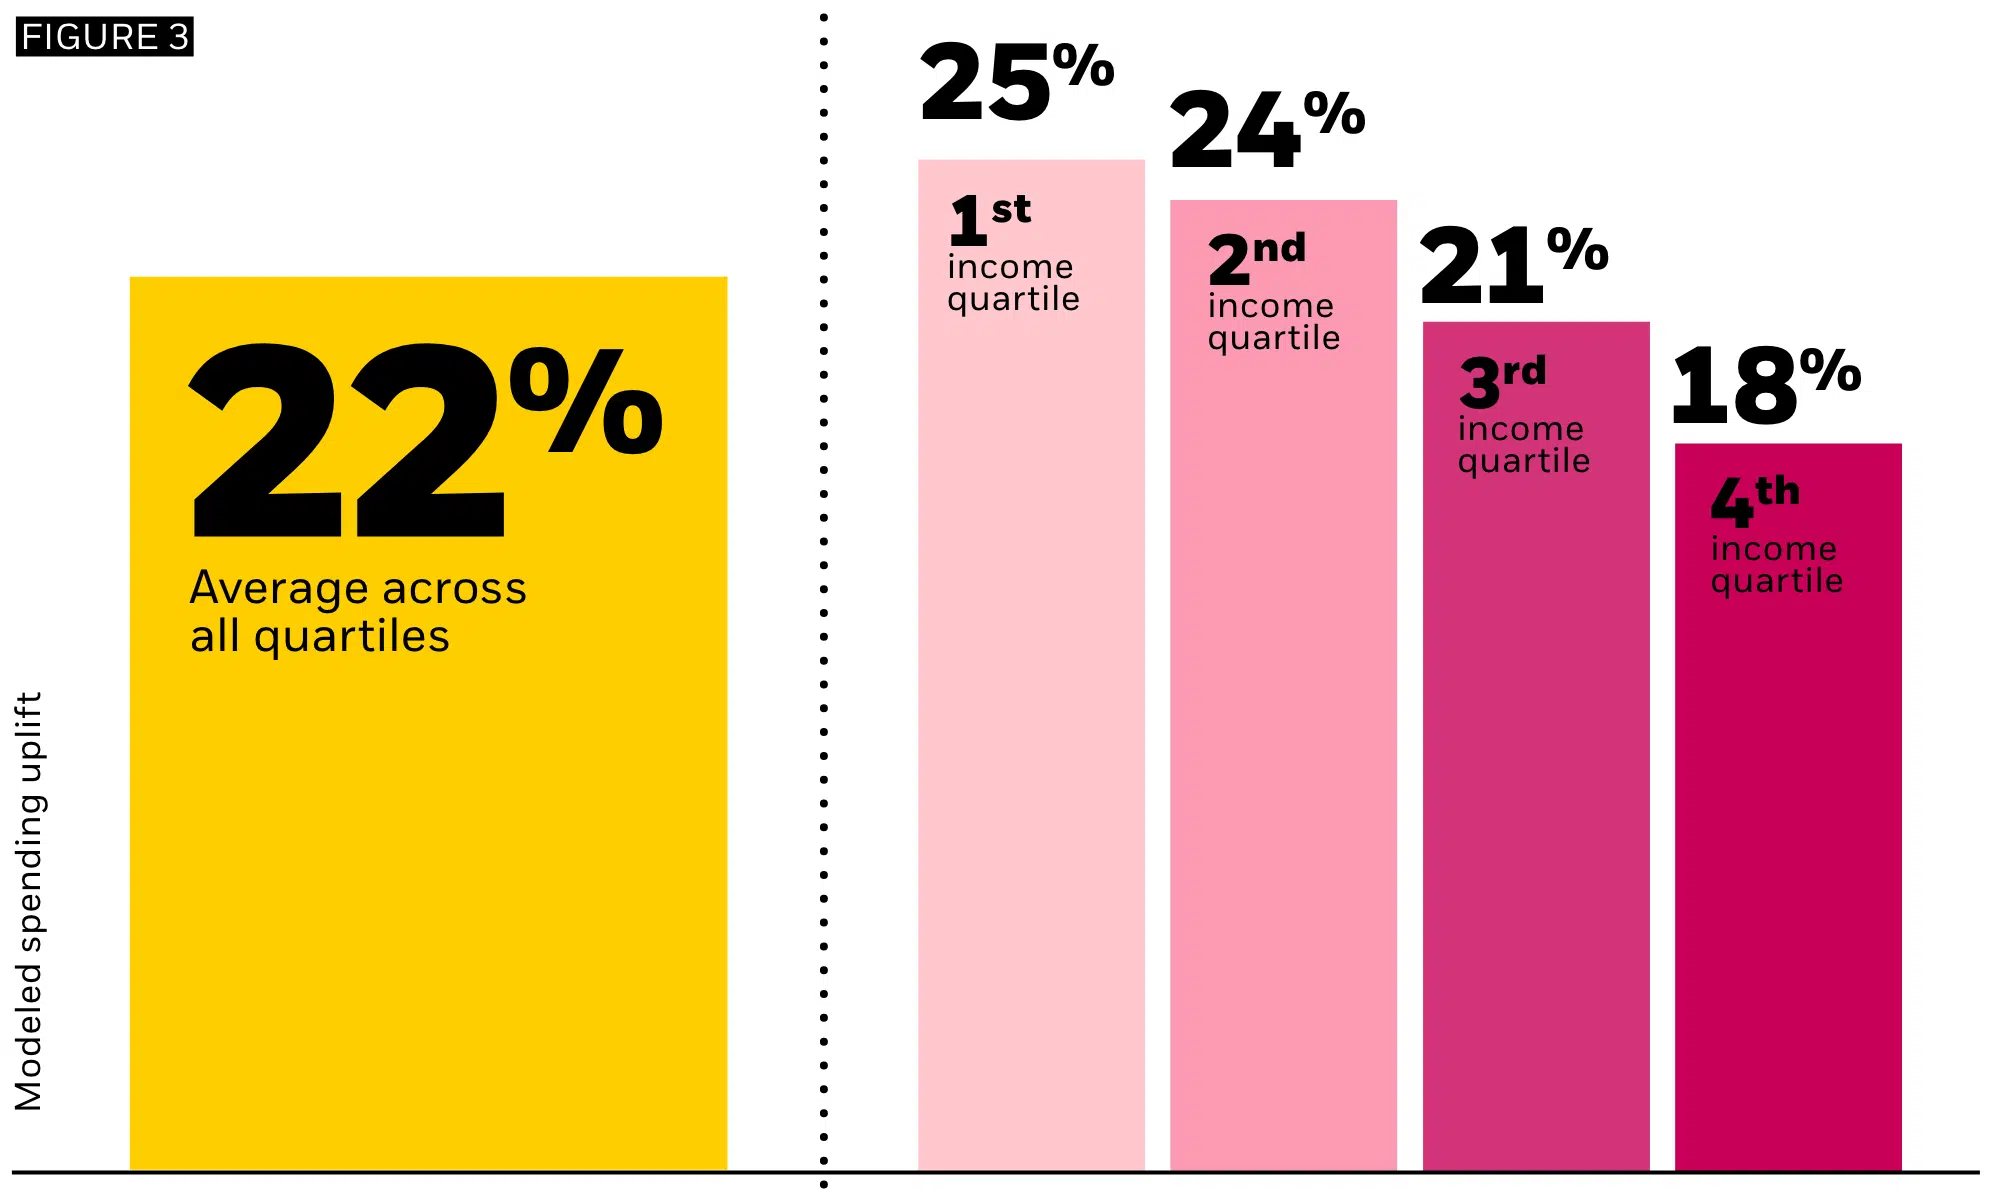
    To address this issue, Blackrock ran simulations in which the retiree used 30% of their savings to buy an income annuity, investing the rest in stocks and bonds in a 50/50 portfolio. The results, according to Blackrock, is that the addition of the annuity increased spending across all income levels by an average of 22%.

    Spending Lift w/ Annuities

  • Total-Return Investing: A Smart Response To Shrinking Yields

    Publication Year: 2021

    Total-return investing generates more retirement spending than income-focused investing, even in a low-yield environment.

    The Vanguard research paper addresses the challenges income-focused investors face in the current low-yield environment. The paper outlines the difficulties of generating sufficient income from a portfolio due to historically low yields on fixed income and equity assets, exacerbated by the financial market disruptions caused by the COVID-19 pandemic in March 2020. For instance, at its 2020 low, the 10-year U.S. Treasury note yielded only 0.52%, significantly below historical levels.

    The paper presents two main strategies for investors to meet their spending needs: (1) altering the portfolio asset allocation to include higher-yielding, potentially riskier assets, or (2) adopting a total-return approach that combines portfolio yield with capital appreciation. The authors caution against the former strategy, noting that shifting towards higher-yielding assets can compromise the original risk profile of the portfolio and reduce diversification. Instead, they advocate for a total-return strategy, which they argue can help minimize portfolio risks, increase portfolio longevity, and allow investors to meet their spending goals more effectively.

    The total-return approach is described as a holistic strategy that considers the investor’s goals and risk tolerance to develop an appropriate asset allocation. This approach aims to support spending through both portfolio yield and capital appreciation, offering several advantages over an income-focused strategy. These include maintaining portfolio diversification, creating more tax efficiency, and allowing more control over the size and timing of portfolio withdrawals.

    The paper also discusses the tax implications of income-focused versus total-return investing, highlighting that income can be taxed more heavily than long-term capital gains, which can result in a higher tax liability and lower after-tax return for income-focused investors.

    In conclusion, the Vanguard research paper argues that a total-return approach is a smarter response to the challenges posed by shrinking yields, providing a more sustainable and flexible strategy for meeting spending needs in retirement. The paper emphasizes the importance of a diversified portfolio tailored to the investor’s unique risk and return preferences, suggesting that this approach can offer better protection against market shocks and more stable portfolio withdrawals.

  • What If You Invested at the Peak Right Before the 2008 Crisis

    Publication Year: 2024

    If you had invested at the market peak just before the 2008 financial crash, you still would have earned a 9.5% annual return through March 2024, suggesting that we shouldn’t obsess over valuations as long-term, buy-and-hold investors.

    Even if an investor is “unlucky” enough to invest at a market peak, they still get reasonable returns over the long run. Specifically, the author found that an investment at the market peak before the 2008 financial crisis still delivered a 345% return through March 2024 (9.5% annual return). This idea is relevant to Lump Sum vs Dollar Cost Averaging and whether one should set Asset Allocation Based on Valuations.

    The article also notes that sometimes we hit a dozen or more market highs in one year. At other times, like from 2009 to 2013, it took 5 years or more before we hit a market high.

  • The State of Retirement Income 2021

    Publication Year: 2021

    Using forward-looking estimates of market returns and inflation, the report concludes that 3.3%, not 4%, is the new safe withdrawal rate.

    The paper concludes that 3.3% is the new safe withdrawal rate. It bases this conclusion not on historical data, as used by Bill Bengen in his 1994 paper. Rather, Morningstar uses estimates of future market returns of a 50/50 portfolio and inflation to reach its conclusion. At the same time, the paper also concludes that the initial safe withdrawal rate can rise to 4.5% if a retiree adopts a flexible spending approach with greater exposure to equities.

    Specifically, Morningstar compared four flexible spending strategies to the inflation-adjusted 4% rule:

    1. Forgoing Inflation Adjustments: This strategy involves starting with a withdrawal system similar to the 4%-rule but skipping inflation adjustments in years following a market downturn. This approach is simple and minimally impacts the retiree’s quality of life, particularly because economic downturns often coincide with low inflation, making the lack of adjustment less impactful.
    2. Required Minimum Distributions (RMD): This method calculates withdrawals based on the retiree’s life expectancy and the portfolio’s value at the end of the previous year, using IRS tables. It ensures that the retiree will not deplete their portfolio prematurely but introduces significant variability in annual income.
    3. Guardrails Method: Developed by Jonathan Guyton and William Klinger, this approach sets an initial withdrawal rate and then adjusts it annually based on portfolio performance. The “guardrails” ensure that the withdrawal rate remains within certain bounds, increasing withdrawals in good years while decreasing them in bad years to prevent overspending.
    4. 10% Reductions Following Losses: Similar to the original Bengen approach of fixed real withdrawals, this method involves making a 10% reduction in withdrawal amounts in years following a market loss. This strategy aims to be a simple way to adjust for market downturns without the complexity of other methods like guardrails or RMDs.

    Each strategy has its trade-offs, including the balance between starting safe withdrawal rates, lifetime withdrawal rates, year-to-year variability in income, and the remaining portfolio value at the end of 30 years. The paper evaluates these strategies to determine their effectiveness in providing retirement income while preserving portfolio longevity.

  • Reality Retirement Planning: A New Paradigm for an Old Science

    Publication Year: 2005

    Retirement withdraw plans should reflect a real (after-inflation) decline in spending, which enables an early retirement and spending more during one’s “go-go” years of retirement.

    The article discusses a new approach to retirement planning that involves decreasing spending needs annually to better reflect how retirees spend money. This method is contrary to the assumptions underpinning the 4% rule and aims to enhance retirees’ quality of life during early retirement years. It proposes reducing spending by varying amounts ranging from about 3 to 4% annually from age 55 (the article assumes early retirement) to 75, and then adjusting spending by inflation from 75 to 85 to reflect the increased cost of healthcare. The article assumes an age 85 end of plan.

    While the idea that retirees reduce spending through retirement is well-documented, the paper’s assumption of a 3 to 4% annual reduction may be too aggressive.

  • An International Perspective on Safe Withdrawal Rates: The Demise of the 4 Percent Rule?

    Publication Year: 2010

    Based on financial market data from 17 developed countries over 109 years, the 4% rule may be overly optimistic in many cases.

    The 4% rule comes from a 1994 paper entitled, Determining Withdrawal Rates Using Historical Data, which relied on U.S. stock and bond returns data. Dr. Pfau’s paper analyzes the viability of the 4% rule by broadening the scope of analysis beyond the United States to include financial market data from 17 developed countries over 109 years. This comprehensive study challenges the universal applicability of the 4% rule, concluding that its success is contingent on the economic and market conditions of specific countries and time periods.

    Pfau’s findings indicate that the 4% withdrawal rate, while historically viable in the U.S., does not hold up when applied to a global context, with many countries experiencing periods where such a rate would have led to the exhaustion of retirement savings well within 30 years. The paper suggests that the variability in market returns, inflation rates, and other economic factors across different countries and historical periods makes the 4% rule overly optimistic for a significant portion of retirees, especially in environments of low-interest rates and high market valuations.

1-10 of 20 results
Topics