What Rate of Return Should You Assume for Retirement Planning
We earn a commission from the offers on this page, which influences which offers are displayed and how and where the offers appear. Learn more here.
Estimating the future returns of your investments is a key part of most retirement plans. It can help us understand our plan’s chance of success, but it can also be the most challenging.
In this article, I’ll walk through my approach along with the tools and resources you can use in your own retirement plan.
Key Takeaways
- A retirement plan’s chance of success is sensitive to our Investment return assumptions. A small change in return assumptions can significantly affect our plan’s chance of success.
- All return assumptions rely, in whole or in part, on historical returns. At one extreme, we can run simulations based entirely on historical returns, which Bill Bengen did in his 1994 paper that gave us the 4% rule. It’s also how some retirement calculators work, such as ficalc. Alternatively, we can use a Monte Carlo simulation to model future outcomes. These simulations rely on the average return and volatility we provide (or the simulator uses), again based on historical results.
- Whatever approach we use should account, at a minimum, for our portfolio’s asset allocation. A 100% stock portfolio should have different return and volatility assumptions than a 60/40 portfolio. The better approaches should also account for current market conditions.
- It’s rarely ideal to use just one return assumption. They should change with changes to our investment plan and to reflect different economic regimes. For example, the current high valuations suggest that future returns over the next decade will be lower than historical averages. Our retirement plan should reflect this reality.
- Running scenarios using different return assumptions is important. It enables us to see how our rate of return assumptions affect our retirement plan’s chance of success. Using multiple assumptions also reflects the fact that no matter how reasonable an assumption is, it’s still an assumption.
How Much Do Return Assumptions Matter?
They matter a lot.
Well, they matter a lot in most cases.
A traditional retirement can last 30 years or longer. Over long periods, the compounding effect of investment returns can significantly impact the success or failure of a retirement plan.
For example, in a recent simulation I was testing with New Retirement, a change from 9% to 7% dropped the chance of success from 90% to 78%. A further drop to 5% lowered the chance of success to less than 15%. In short, small differences in average returns can compound over time to create large differences in portfolio balances and the sustainability of withdrawals.
However, there are cases where return assumptions matter less. Retirees with very large portfolios relative to their spending needs may have a high chance of success across a wide range of return assumptions. This can occur with retirees who rely primarily on guaranteed sources of income such as Social Security and a pension, as well as retirees with very large portfolio balances.
Return assumptions are also important at the account level. The return assumptions for traditional retirement accounts affect projected balances when required minimum distributions begin. These balances in turn determine the amount of the RMDs, which represent taxable income. Likewise, return assumptions for Roth accounts and Health Savings Accounts determine the amount of a retiree’s tax-free withdrawals.
Making the Initial Return Assumption
My approach to setting return assumptions is to start with my asset allocation. There are several free resources we can use to see how any asset allocation has performed over time. For example, Vanguard offers the following chart showing returns by asset allocation from 1926 to 2022:

You’ll note that the stock/bond allocations change in increments of 10%. Assuming a 40% bond and 60% stock allocation, one could use 8.6% as a starting point.
You can also use a tool like Portfolio Visualizer. It shows a similar result (8.76%) for the same asset allocation:
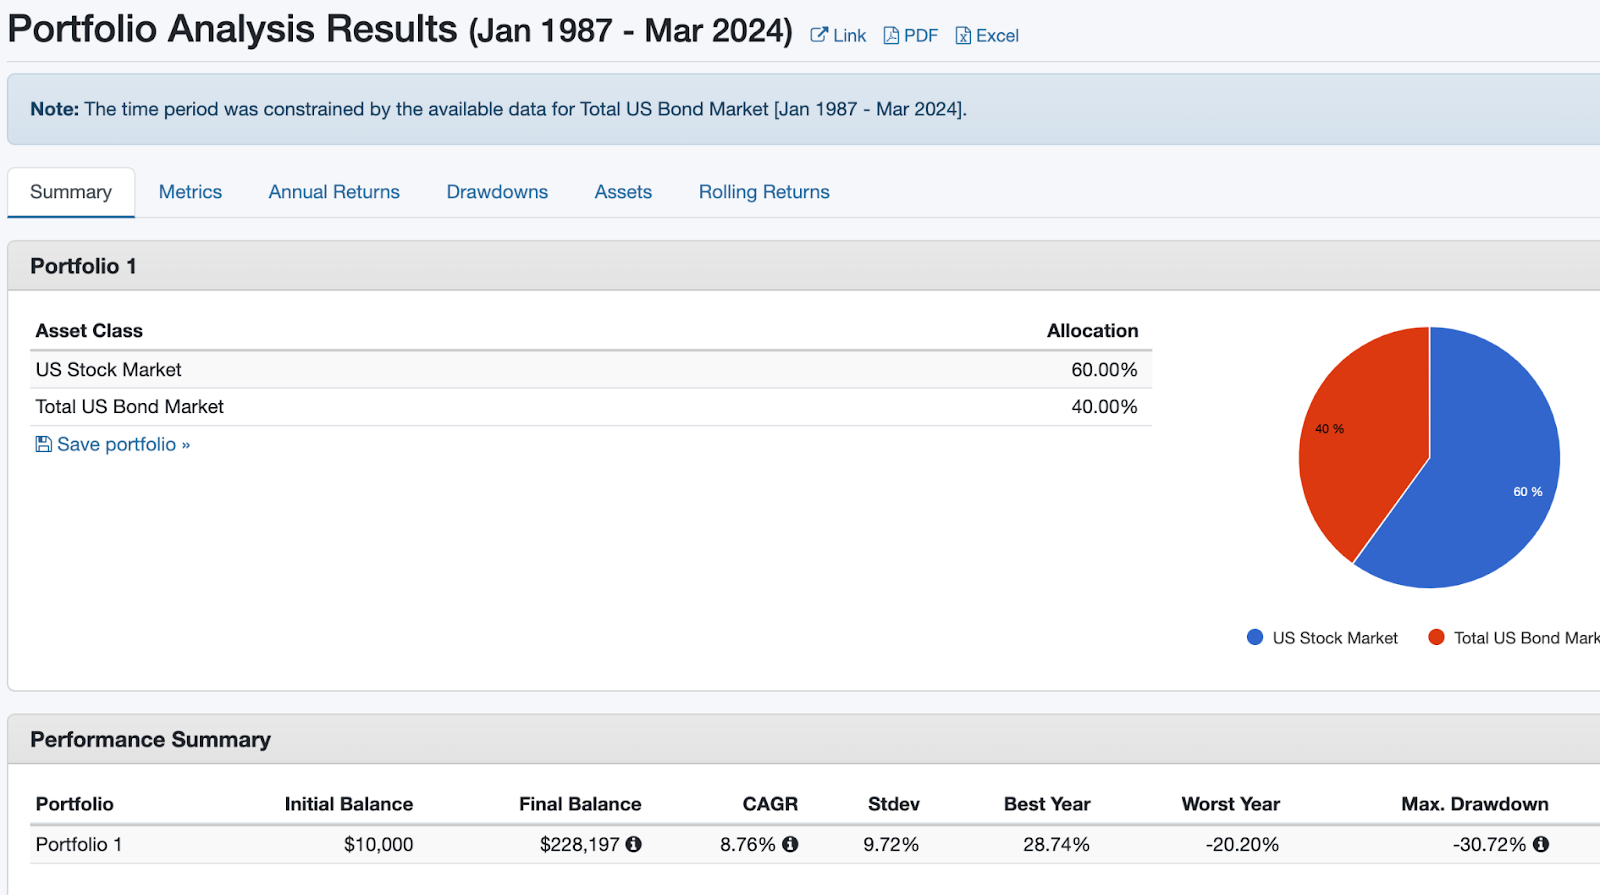
Portfolio Visualizer has the advantage that you can add different asset sub-classes, such as international, small cap and so on. You also aren’t limited to asset allocations in increments of 10%. On the downside, its data doesn’t go back to 1926.
How Do We Now Use the Return Assumption?
One approach would be to assume that our portfolio will earn the same return each year in retirement. Using the above data, for example, we could assume our portfolio will return 8.6% each year in retirement. Throw in an assumption on the future rate of inflation and run the results through your favorite calculator—easy peasy, lemon squeezy, as a friend of mine likes to say.
This approach is common in financial planning software. For example, New Retirement and ProjectLab, two of my favorite planners, require users to input an average return for each of their retirement accounts. The planners then determine the chance of success based on these return assumptions.
Relying solely on this approach, however, overlooks a gremlin lurking in our retirement plan–sequence of returns risk.
Sequence of Returns Risk
Using average annual returns has one glaring problem. It will overstate a retirement plan’s chance of success. Why? Because of something known as the sequence of returns risk.
It turns out that using average annual returns can be misleading. even if we know that our portfolio will return 8.6% on average, we don’t know the actual returns from year to year. we know they will vary, sometimes significantly. This variance matters when a retiree is drawing down their savings.
Fun Fact
While Bill Bengen’s 1994 paper is best known for giving us the 4% Rule, that was just a byproduct of the paper’s real contribution to retirement planning. The real contribution was that you cannot simple assume a portfolio will earn the same rate of return each year in retirement. Doing so will overstate the plan’s true chance of success.
Imagine two retirees who both average 8.6% returns over a 30-year retirement. in one case, a retiree enjoys higher returns in the first 15 years, followed by much lower returns in the second half of retirement. For our other retiree, the exact opposite happens. They have lower returns in the first 15 years of retirement, followed by higher returns in the last half of retirement
While they both averaged 8.6% returns, their outcomes were very different. The combination of annual distributions and declining market values in the first half of retirement for the unlucky retiree produces worse outcomes. This is why Dave Ramsey’s claim that an 8% withdrawal rate is reasonable because the stock average of 12% is flat-out wrong. He fails to grasp the sequence of returns risk.
Monte Carlo Simulations
A better approach is to use Monte Carlo simulations. These run through hundreds, if not thousands, of simulations, varying the returns of a portfolio and inflation and testing whether a retiree’s money will last throughout retirement. Monte Carlo simulations still require some assumptions, including average annual returns and the variability of those returns.
There are some criticisms of these simulations. The primary one that I’ve encountered is that they can assume certain simulations that are either too good to be true or too dire to be realistic. These tail events, as they are sometimes called, can skew the results. Nevertheless, if the simulation runs 500, 1000, or even more simulations, I think the final outcome can be very useful to a retiree.
The output of the simulations shows a retiree’s chance of achieving various outcomes. Here’s an example from New Retirement:

Each line represents the chance that the various results will be achieved. For example, the top line shows how much money a retiree would have at the end of their retirement plan in the best 10% of cases. Monte Carlo simulations can also indicate the overall chance that a retiree will not outlive their money.
What About The Market’s Current High Valuations?
A common objection to any simulation based on past averages is that they don’t account for current market conditions. As I type these words at my favorite coffee shop, the Shiller PE Ratio is near an all-time high:

If market returns from year to year were random, current market conditions wouldn’t matter. Returns aren’t random, and neither are safe withdrawal rates.
As an example, here are “successful” and “unsuccesful” 30-year retirements since the 1960s assuming an initial 5% withdrawal rate:

Notice that the green checkmarks (success) and red X’s (failure) are not random. They tend to bunch together. It also suggest that maybe, just maybe, we are headed to a regime change (e.g., higher inflation and interest rates) that could bring us more red X’s.
How do we model this possibility in our retirement plan?
Modified Average Annual Returns
Some tools also allow us to model the sequence of returns risk by setting different return rates over different retirement periods. For example, with New Retirement, you could set the assumed annual average rate to be lower over the first 5, 10, or 15 years of retirement, followed by a higher rate of return for the remainder of retirement. In this way, you can model a bad sequence of returns risk as part of your plan.

You can play with different assumptions. I like to shorten or lengthen the time of poor returns from five to 15 years. I also change just how poor the returns will be, along with changes in inflation assumptions.
How to Sidestep Estimating Future Returns
For those who hate the idea of estimating future returns, I have two options for you. First, you can run simulations entirely based on historical returns and inflation. Second, you can use a retirement planner that makes the assumptions for you.
Historical Returns
With this approach, we can also use actual returns and inflation data to run simulations. Bill Bengen used this approach in his famous 1994 paper that gave us the 4% rule.
One of the challenges is selecting the historical data to use. Bengen limited his data to U.S. stock and bond markets, specifically the S&P 500 Index and intermediate term U.S. treasuries. This approach has come under criticism lately, particularly given that markets and other countries have largely not supported an initial 4% withdrawal rate. The point is that while the last 100 or more years in the US has supported a 4% withdrawal rate, the future is far less certain.
These nuances aside, using historical returns has a number of advantages. First, it accounts for the sequence of returns risk as some starting years were followed by difficult stock markets and high inflation. Retirements beginning in the late 1960s and early 1970s are a good example.
Second, there’s no need to make assumptions about average returns, variance, or even inflation. There is an assumption that the historical data is a reasonable indicator of future markets and inflation. And here, some argue that the current stock market valuations and relatively low yields make relying on historical data more uncertain.
In my view, using historical data is an important part of a retirement plan. It gives us a good sense of how realistic our plan is. Because there’s no guarantee that history will repeat itself, however, relying solely on historical returns is not ideal. That being said, at least one study has found that simulations based on historical records accurately predict the future.
Let the Retirement Planner do the Work
Some retirement planners make the assumptions for you. One of the more popular options is Empower’s free retirement planner.
Empower enables you to link all of your financial accounts, track your cash flow, manage a budget, evaluate your investments and plan your retirement.
For its retirement planner, it assumes rates of returns based on the types of investments in your accounts. It knows what investments you have if you’ve linked your accounts (e.g., 401(k), IRA, taxable accounts).
In the past it relied exclusively on historical data. Recently, however, it incorporated a financial model developed by Morningstar. This allows Empower’s tool to factor in current market conditions. Time will tell just how accurate Morningstar’s model is.
My Approach and the Tools I Use
My Approach is simple and straightforward. First I determine the stock to bond asset allocation for each of our investment accounts. Our allocation is different from one account to the next. We keep bonds in our traditional retirement accounts, stocks in Roth, HSA and taxable accounts, and a small amount of cash in taxable accounts.
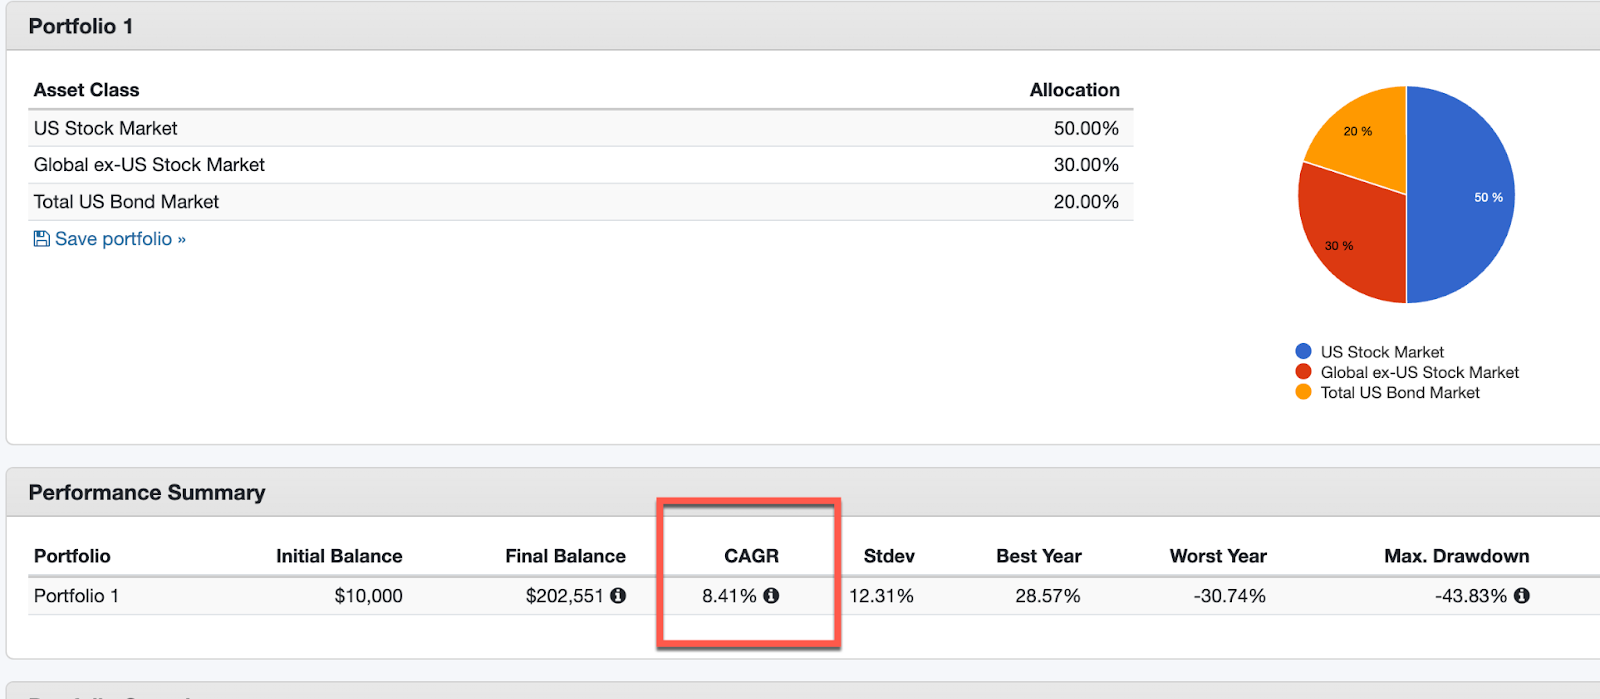
Next I replicate our asset allocation in Portfolio Visualizer as noted above. This will tell me the compound annual growth rate of that portfolio over decades, typically beginning in the 1970s or 1980s.
For example, the three fund portfolio assuming an 80/20 stock to bond allocation, has a compound annual growth rate of 8.41% from 1987 to 2024.
I use the compound annual growth rate as my optimistic rate of return in New Retirement. Given that this is an average return, some might argue that this is overly conservative. However, I prefer to take a conservative approach.
For the pessimistic rate of return, I take approximately one-half of this compound annual growth rate. In this case, that would be about 4.25% (my actual assumptions are 9% and 5% for most of our accounts). The key here is not just the pessimistic rate of return but also the pessimistic rate of inflation. I ensure that my pessimistic inflation rate is never higher than my pessimistic compound annual growth rate. Otherwise, the results become so dire that they are practically useless.
To test a bad sequence of returns, I assume a 0% to 5% rate of return for the first ten years of retirement. One thing to note here. Using pessimistic rates of return will often result in a very low chance of success. New Retirement, however, lets use separate “Must Spend” expenses from “Like to Spend” expenses. You do this by using its “Detailed Budgeter.”

When running the simulation using pessimistic assumptions, I like to to focus on the Must Spend expenses (the screenshot above is from a demo account, so the Must Spend expenses haven’t been separated out). In a really bad market environment, I’m likely to forego most discretionary spending anyway.
Conclusion
I hope you found this helpful. Feel free to leave comments below with how you approach setting return assumptions or with any questions you may have.
