Decoding The “Chance of Success” In Your Retirement Plan
Some of the links in this article may be affiliate links, meaning at no cost to you I earn a commission if you click through and make a purchase or open an account. I only recommend products or services that I (1) believe in and (2) would recommend to my mom. Advertisers have had no control, influence, or input on this article, and they never will.
You enter your income, expenses, investments and liabilities into your favorite retirement planner. You click a button, the software does some kind of calculation, and out pops a single number.
It may be 87%. Maybe it’s 72%. Or it could be 15%. Whatever the number, you’re told it represents your retirement plan’s “Chance of Success.”
What exactly does that mean? How is it calculated? And what “Chance of Success” should you aim for? We’ll tackle these and other questions in this article.
What is a Retirement Plan’s Chance of Success?
To understand that number your retirement plan is displaying, we need to start with how it’s calculated.
Most retirement planning software uses what’s called Monte Carlo simulations. Based on assumptions about average investment returns, inflation and other factors, the software simulates hundreds if not thousands of retirement outcomes. Imagine one simulation shows strong stock market returns and low inflation, while another shows weak returns and high inflation.
Ask AI: Monte Carlo simulations in the context of retirement planning software involve running multiple simulations to determine the likelihood of a retirement plan being successful. The software takes into account various factors such as investment returns, inflation, expenses, and other variables to simulate different retirement outcomes. By running these simulations multiple times, the software can calculate the chance of success of the retirement plan, which is represented as a percentage. A higher percentage indicates a higher likelihood of the plan being successful in providing for a comfortable retirement. By using Monte Carlo simulations, retirement planning software can provide more accurate and realistic projections for individuals planning for their future.
Run this simulation 1,000 times, and then add up the number of simulations in which the retiree’s money lasted through the end of the plan. If the money lasted 870 out of 1,000 simulations, the plan’s chance of success would be 87%.
What the Chance of Success Doesn’t Tell You
Let’s stick with the hypothetical 87% chance of success. We know this tells us that in 870 out of 1,000 simulations, our money lasted through retirement. That’s helpful to know, but there are some important things left out.
First, by itself it doesn’t tell us how much money we have left at the end of the plan. A simulation is deemed “successful” whether we die with $1 left in the checking account or $1 million. While this may not matter much when we are gone, it does matter if we nervously watch our bank account dwindle in the last years of our life.
Second, for those 130 failed simulations, it doesn’t tell us just how bad the failure was. Did we run out of money in year 13 of a 30-year planned retirement, or did the money run out in year 29. The difference matters. The chance of success number, by itself, doesn’t tell us this.
Free tools like FiCacl and the Rich, Broke or Dead? calculator can show you just how “successful” or not your spending plan would be.
A Better Way to Think About A “Failed” Retirement Plan
With the Chance of Success comes the other side of the coin, a Chance of Failure. Imagine seeing a 70% Chance of Success in your retirement plan. Not only is a ‘C-‘ nothing to get excited about, but we quickly realize our plan has a 30% Chance of Failure. That’s not ideal.
Except maybe it is. The reality is that we aren’t going to blindly march forward for 30+ years in retirement as our finances get pummeled by a bad stock market and high inflation. We aren’t going to “Thelma & Loise” our retirement right off a cliff.
Instead, we’ll revisit our plan each year and make adjustments as necessary. As such, a 70% chance of success doesn’t mean a 30% chance of failure. Rather, it means a 30% chance we’ll need to make some changes along the way.
Why You Should Never Aim for a Perfect Score
Particularly for you overachievers, it may seem at first that a 100% chance of success is the best outcome. It’s not.
A 100% chance of success requires you to significantly underspend your retirement savings. That’s because Monte Carlo simulations will include hypothetical retirements with very poor market returns and high inflation. To overcome these bad simulations, you must spend a lot less than you could in most “normal” or even “mediocre” retirement outcomes.
To put 100% into perspective, recognize that a 50% chance of success means your money is just as likely to last you in retirement as not. Fifty percent marks the point at which you are neither overspending nor underspending. It may be too risky for you, and it is for me, but it shows just how extreme a 100% chance of success would be.
So what should we aim for?
What’s a Reasonable Chance of Success According to the Experts
Let’s start with Bill Bengen, the father of the 4% Rule. In his 1994 paper, he required a 100% chance of success. That’s what gives us the 4% Rule. If instead we were comfortable with say a 90% chance of success, 4% becomes roughly the 4.5% Rule. Go down to 80% and we get the roughly 5% Rule.
In a 1996 paper, Bengen specifically addressed whether a client could accept a chance of success lower than 100%. Here’s what he had to say: “I would advise you to be careful with any withdrawal rates having a probability of “success” much less than 85 percent, which corresponds to an increase in withdrawals above the “safe” level of about 11 percent, and a minimum portfolio longevity of about 24 years. . . . That’s a personal bias. I hate to see people run out of money–particularly if they’re my clients!”
Did you know? Bill Bengen ran simulations based on historical market returns and inflation rates. You can run similar simulations for free with the ficalc app.
T. Rowe Price aims for a success score of 85 to 90%.
Another financial planner recommends 85%: “The ‘just right’ success probability for your retirement plan should be in the 75-90% zone. Aiming for 85% is ideal.”
And in one article, a CFP argued the case for just a 50% chance of success. Importantly, the article assumes that retirees will make monthly adjustments to their spending to maintain a 50% chance of success throughout retirement. In “bad” markets, these adjustments could require a substantial decrease in spending.
A Better Way to Evaluate Your Plan’s Chance of Success
There are two key factors that these and many articles on a plan’s chance of success fail to address. First, they don’t account for how conservative or agressive the assumptions are within the plan. Second, they fail to address how much spending flexibillity a retiree has.
A Plan’s Assumptions
Retirement planning is an exercise in making assumptions and then running what-if scenarios.
Imagine I tell you that New Retirement shows my plan as having a 40% chance of success. That sounds awful. But what if then told you I was assuming a 3% return on my investments, a 6% rate of inflation, and that I would retire at 60 and live to be 110. Now a 40% chance of success sounds miraculous. And under those assumptions, it would be!
The point is that we must evaluate our chance of success in light of how conservative or agressive our assumptions are.
Key assumptions include the following:
- Investment return assumptions to be used in Monte Carlo analysis
- Inflation
- Retirement date
- Life expectancy
- Expenses
- Income
We try to make the “best” assumptions we can. In some cases we may lean toward a conservative assumption. And then we continue to run what-if scenarios.
Here’s the point. When we are making very conservative even pessimistic assumptions, we shouldn’t demand the same chance of success as when we enter aggressive, optimistic assumptions.
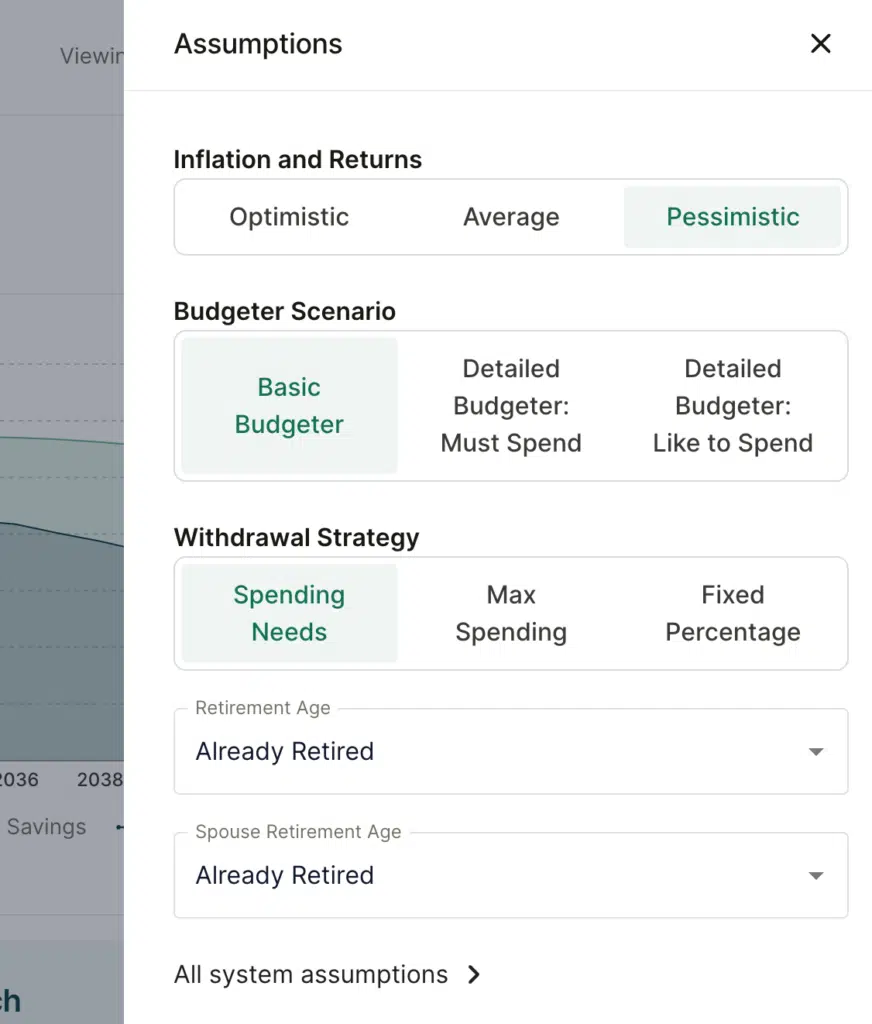
We can see this clearly in how New Retirement works. You enter an optimistic rate of return for each investment account and a pessimistic rate of return. For me that’s typically 9% and 5%. New Retirement then allows you to run Monte Carlo simulations based on either of these two assumptions, or an average of the two.

When I use optimistic assumptions, I want to see a relatively high chance of success, such as 90% or higher. When I run pessimistic assumptions, I’m not distraught with a 50% chance of success, or even less. That’s why there is no one “right” chance of success.
Spending Flexibility
The second critical factor is the nature of your expenses. Do you need every dime of the expenses you’ve entered into your plan to pay for the necessities of life, or have you included discretionary spending?
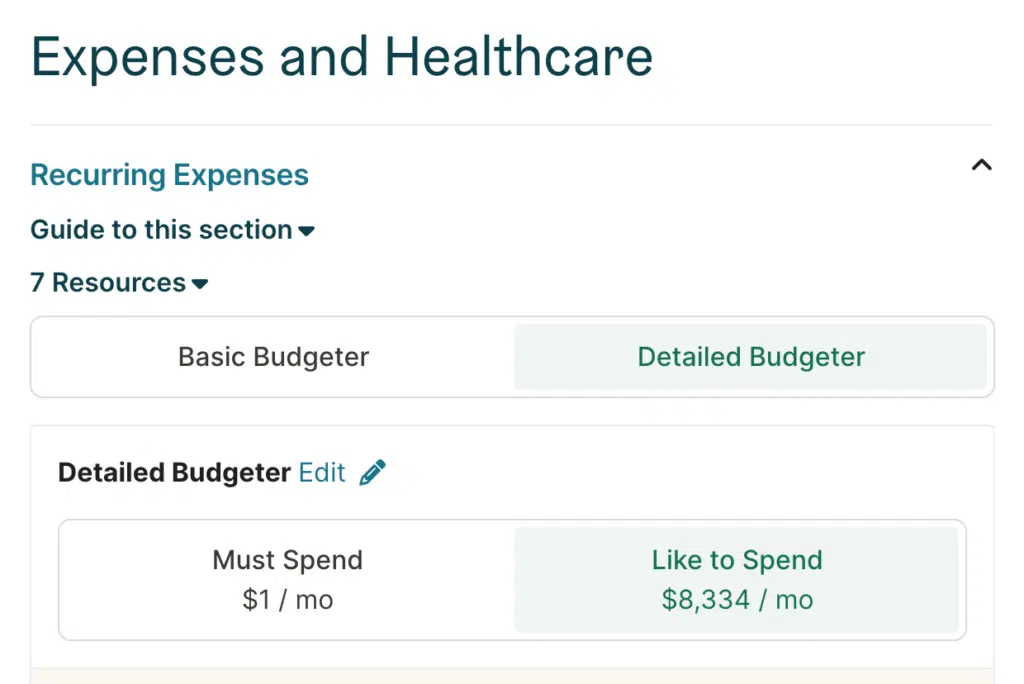
In New Retirement, you can divided your expenses between “Must Spend” expenses and “Like to Spend” expenses. You can then run a Monte Carlo simulation just on the Must Spend expenses or on both.

For Must Spend expenses combined with say average assumptions, I want to see at least an 80% chance of success. That’s my comfort level. With Like to Spend, however, I’d accept a lower success rate.
The key point is to evaluate your Chance of Success in light of the assumptions in your plan and the flexibility in your spending.
There is No One “Right” Chance of Success
Imagine two retirees. Same everything. They both have a 75% chance of success.
Now, let’s assume one has included a lot of discretionary spending in their plan, while the other has not included any.
Tools
There are several tools you can use to run retirement planning simulations. Here are the three mentioned in this article.
Rob Berger is a former securities lawyer and founding editor of Forbes Money Advisor. He is the author of Retire Before Mom and Dad and the host of the Financial Freedom Show.