The Ultimate Investment Tracking Spreadsheet
We earn a commission from the offers on this page, which influences which offers are displayed and how and where the offers appear. Learn more here.
Keeping tabs on your investments can be a headache. That’s particularly true, if like me, you have a number of different accounts. While my favorite investment tracking app is Empower (previously called Personal Capital), another tool I use is a free investment tracking spreadsheet.

I’m going to walk through the spreadsheet in this article and video (see below). You can get a free copy of the spreadsheet here. It’s extremely easy to use and will help you track your investments, asset allocation and mutual fund fees. And as you’ll see, it’s a great tool when it comes to rebalancing your portfolio.
UPDATE: There is a new version of the spreadsheet called Portfolio Tracker 2.1. You can create a copy for yourself here. You can read about it on the Bogleheads’ Forum here. And here is my video on the new tool:
It consists of three sheets–Asset Class, Holdings and Stocks.
Investment Holdings Spreadsheet
The first step in using the spreadsheet is the Holdings sheet. This is where you should start. The data that I have in here is just demo data. This is not my actual portfolio, though, I do own many of the mutual funds that are listed here. But this is where you start and you want to enter your portfolio. And you could include mutual funds, ETFs, stocks, whatever you’d like.

The color coded cells in the columns for Account, Symbol (i.e., Ticker) and Shares are the cells where you need to enter information. All of the other cells contain calculated values based on the Ticker.
For each fund we need to designate an asset class (Category column). The drop-down contains most major asset classes, but you can add more. For example, you could add categories for REITs, emerging markets or small cap stocks. (The video below explains how to do this.)
Next you’ll enter the number of shares that you own for each investment. The spreadsheet pulls in the price using a Google Finance function, and the total value is then automatically calculated based on a simple formula. It works the same with the fund expense ratio. A Google Finance function pulls in the data and the weighted expense ratio is just a simple formula.
Individual Stock Spreadsheet
The spreadsheet works with individual stock holdings as well. The original version of this spreadsheet, linked to above, contains a separate sheet for stocks. In the current version I use, I just incorporate them into the Holdings sheet. Google Finance functions pull in the same data for stocks as it does for mutual funds (except there’s no mutual fund expense ratio).
In terms of asset allocation, you have two options. You can classify stocks just like we classify mutual funds. I could, for example, classify my holdings of Apple and Berkshire as US stocks. Alternatively, you could create a separate classification called Stocks and separate them from mutual funds and ETFs for purposes of asset allocation. That’s what I’ve done because my Apple holdings have grown so much it skews my asset allocation plan (that’s a good problem to have!).
Asset Class Spreadsheet
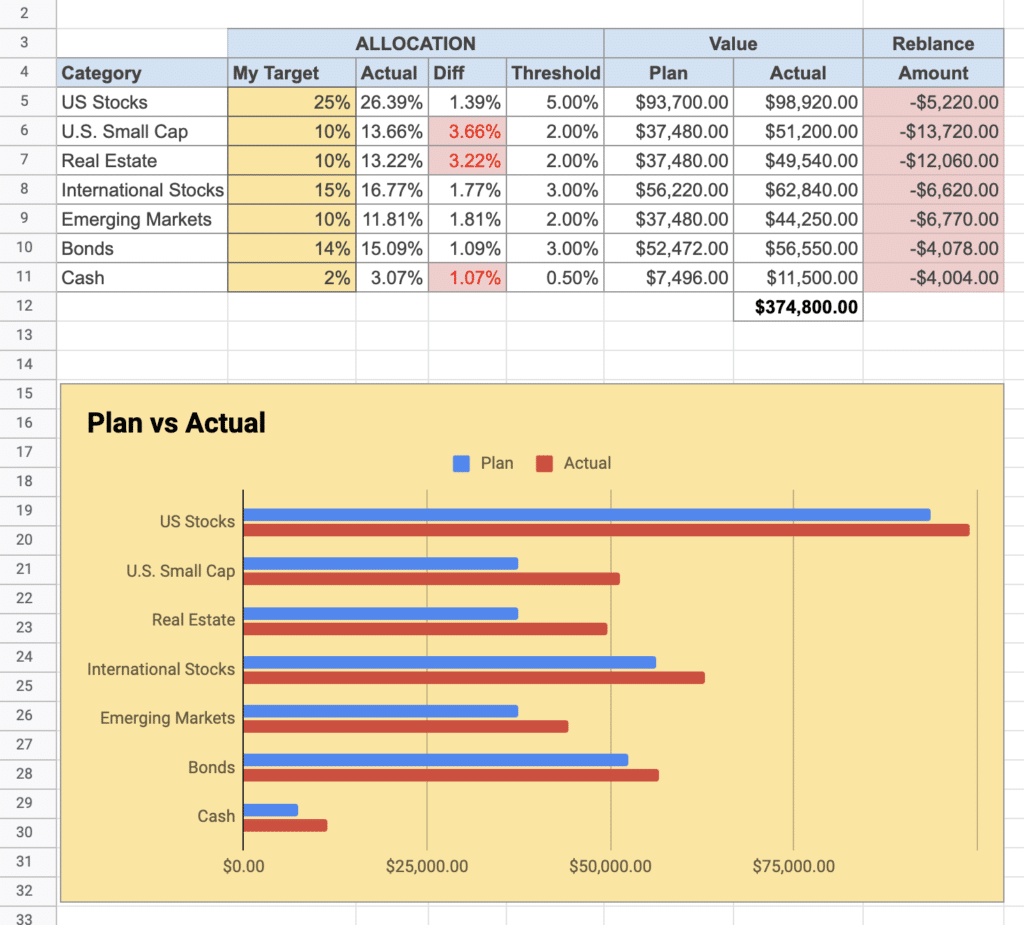
Once you have all of your investments into the holdings sheet, we can then now go to the Asset Class tab. This is where the magic happens. There’s a lot going on here and I want to walk through it for you.

This is the target asset allocation that we’re using in the spreadsheet. It’s in the My Target column. You’ll want to put in your own target asset allocation. If you add other categories beyond what I have in the spreadsheet, you’ll want to add rows for each here. The best asset allocation for you is going to depend on your age, debt, investment goals, time horizon, risk tolerance, and other factors.
Once you have your target asset allocation, the sheet compares it to your actual allocation. Next you’ll see the difference between the actual portfolio value and what the target is. Now you’ll notice that some of these cells are red and some are white. Red cells mean that the difference between our target and actual allocation is greater than the Threshold we’ve defined in the next column.
As a general rule, I set the threshold for rebalancing at 20% of the allocation for each asset class. For example, an asset class with a 25% allocation would have a threshold of 5%. An asset class with a 10% allocation would have a 2% threshold. This is based on research by Dr. Gobind Daryanani, CFP (See Opportunistic Rebalancing: A New Paradigm for Wealth Managers, Journal of Financial Planning, January 2008).
The significance of the threshold is that once an asset class exceeds that threshold, it turns this cell red. Now it’s up to you to rebalance your portfolio, always keeping tax consequences in mind. Of course, you can set the threshold to whatever you want. To help with rebalancing, I’ve added a column to my current spreadsheet to show the amount by which each asset class is over or under my target allocation.
Video
In this video I walk through how to use the spreadsheet. Keep in mind that I’m regularly updating the spreadsheet to add new features, so the current version may be slightly different than what you see in the video.
Final Thoughts
I use this investment tracking spreadsheet primarily to rebalance my portfolio. It’s just much easier than any other stock tracking app. To monitor my asset allocation, investment fees, performance, and retirement goals, I rely on Empower, but there are several really good investment tracking apps available.